分部信息
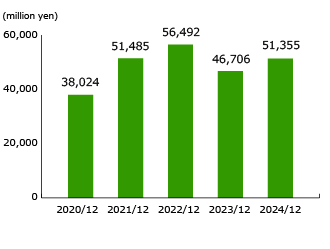
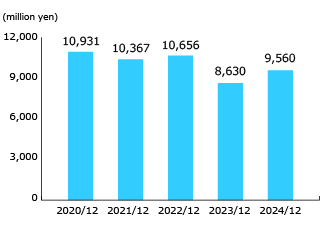
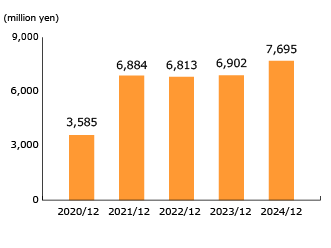
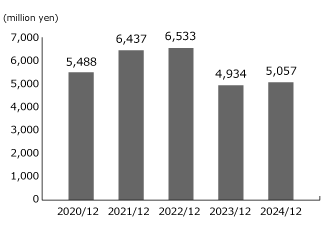
各部门的销售(客户销售)

Machine Tool Operations

Industrial Machinery Operations

Food Processing Machinery Operations

Other Operations

(million yen)
| 2020/12 | 2021/12 | 2022/12 | 2023/12 | 2024/12 | ||
|---|---|---|---|---|---|---|
 |
Machine Tool Operations | 38,024 | 51,485 | 56,492 | 46,706 | 51,355 |
| Industrial Machinery Operations | 10,931 | 10,367 | 10,656 | 8,630 | 9,560 | |
| Food Processing Machinery Operations | 3,585 | 6,884 | 6,813 | 6,902 | 7,695 | |
| Other Operations | 5,488 | 6,437 | 6,533 | 4,934 | 5,057 | |
| Total | 58,030 | 75,174 | 80,495 | 67,174 | 73,668 | |
 |
Machine Tool Operations | 2,896 | 7,176 | 7,046 | 798 | 3,447 |
| Industrial Machinery Operations | 596 | 503 | 820 | -478 | 823 | |
| Food Processing Machinery Operations | 65 | 830 | 447 | 876 | 969 | |
| Other Operations | 319 | 811 | 313 | -954 | -323 | |
| Adjustments | -2,025 | -2,507 | -2,814 | -3,060 | -2,685 | |
| Total | 1,852 | 6,813 | 5,813 | -2,819 | 2,231 | |
