海外销售收入信息
Overseas Sales
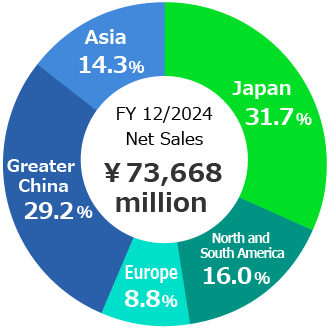
Overseas Sales Ratios
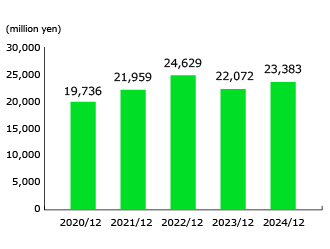
Japan
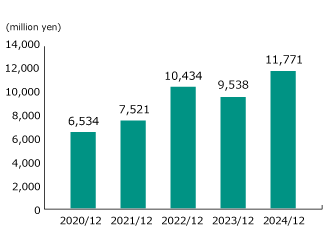
North and South America
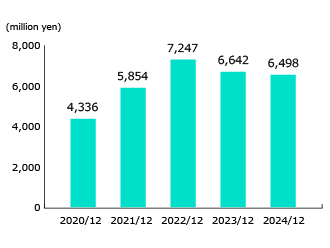
Europe
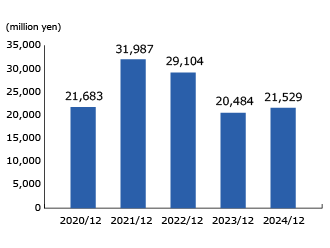
Greater China
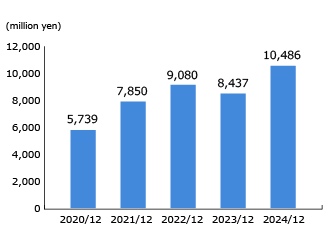
Asia
(million yen)
| 2020/12 | 2021/12 | 2022/12 | 2023/12 | 2024/12 | ||
|---|---|---|---|---|---|---|
 |
Japan | 19,736 | 21,959 | 24,629 | 22,072 | 23,383 |
| North and South America | 6,534 | 7,521 | 10,434 | 9,538 | 11,771 | |
| Europe | 4,336 | 5,854 | 7,247 | 6,642 | 6,498 | |
| Greater China | 21,683 | 31,987 | 29,104 | 20,484 | 21,529 | |
| Asia | 5,739 | 7,850 | 9,080 | 8,437 | 10,486 | |
| Total | 58,030 | 75,174 | 80,495 | 67,174 | 73,668 | |
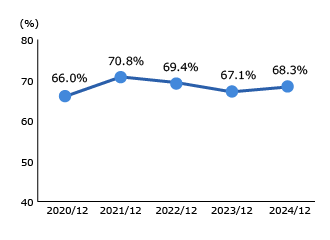
| Overseas Sales Ratios | 66.0% | 70.8% | 69.4% | 67.1% | 68.3% | |
 |
USD | ¥106.76 | ¥109.90 | ¥131.62 | ¥140.67 | ¥151.69 |
| EUR | ¥121.88 | ¥129.91 | ¥138.14 | ¥152.11 | ¥164.05 | |
| CNY | ¥15.48 | ¥17.01 | ¥19.45 | ¥19.81 | ¥21.01 | |
| THB | ¥3.42 | ¥3.44 | ¥3.75 | ¥4.04 | ¥4.30 | |
